


Map Your Jazz Fest: Experience, Scale, and Mobility at an American Festival
By Helen Regis and Shana Walton
Introduction
Jazz Fest has many maps. Visitors to the festival may purchase a glossy color map in a program book, download one from nojazzfest.com or find one in a newspaper or Offbeat magazine's Jazz Fest issue. Staff, volunteers, and performers receive a more technical-looking map of line drawings that includes staff entrances (Belfort, Trafalgar, and Mystery gates) and specific sites (such as the Foundation's Fans of the Fest tent, the Foundation Pavilion, or the Sync Up hospitality area–all of which are highlighted in a map distributed to Foundation volunteers). While the staff maps are somber and dense with information, visitor maps typically include large swaths of color and focus on music stages, food, drink, ATMs, and bathrooms, the foundational necessities of consumption and festivalizing.
This article explores a very different kind of map—hand-drawn maps created by festgoers themselves, as they were invited to express their vision of and personal experience of the festival and its landscape.1 In total, we collected more than two hundred maps between 2011 and 2014, with a team comprised of two seasoned fieldworkers and students from LSU. The maps were also exhibited at the festival in 2014. Both nola.com and Offbeat, as well as some out-of-town media, covered the mapping project. An initial reaction to the maps by Shana, one of the authors, was quoted by Offbeat writer Stephen Maloney:
“The funny thing is that the maps are all very different,” Walton said. “I would have thought it would have been more like going to a shopping mall, where everybody goes to the food court, everybody goes to Dillard's, and so on. In some ways, Jazz Fest is an enclosed space. There's only so much you can do. It turns out that the maps don't really overlap that much.” (Maloney 2014)
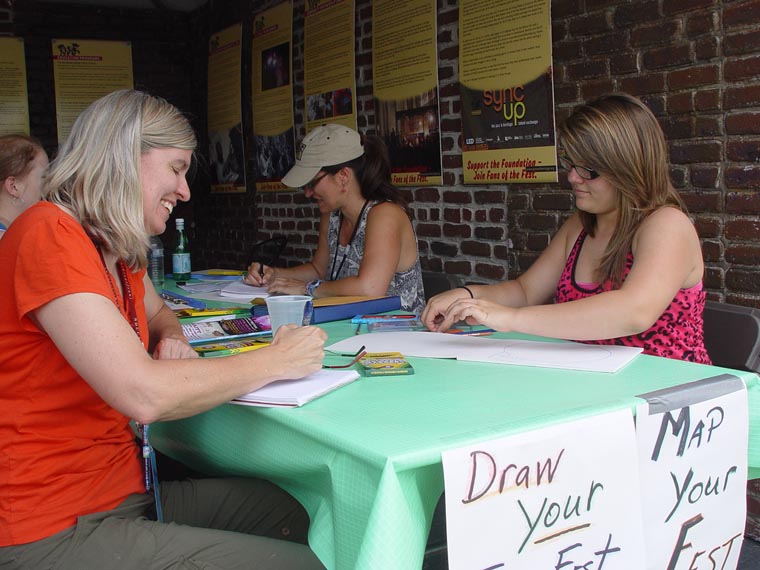
In this paper, we explore a small number of the maps collected between 2011 and 2014 to illustrate their ability to raise issues in festival landscapes. The maps range from the technical and meticulously detailed to the fantastical, from people seeking a moment of fun to people expressing deeply committed fandom. Although our analysis is ongoing, this preliminary offering shows that many maps point to structural tensions in the festival that reflect social issues in North American society and New Orleans specifically. Before we turn to those issues, we will discuss the scholarship on hand-drawn or vernacular maps and our process for making the maps. As a methodology for engaging festgoers, this informal and playful interactive technique allowed us to talk to a wide variety of people and explore spatial dimensions of the festival. Moreover, the mapmaking exercise provided keen insight into important social issues embedded in festival landscapes [Figure 1].
Maps Drawn by Hand
Hand-drawn maps—also referred to as mental maps, cognitive maps, or vernacular maps—have a long history in social practice and in the field of cultural geography. Since the time of Franz Boas (1935), geographers and anthropologists have used hand-drawn maps as a way of engaging with collaborators and learning about their world views and perceptions of the social and physical environment.2 Linguistic anthropologists and dialectologists, in particular, have long used mapping to get at folk taxonomies of dialects, place, and regional identities (Preston 1982, 1985). Geographers have pointed out that these vernacular maps are “personal understandings of the world that may be or may not be maplike, and bear a likeness to real space” (Downs and Stea 1977: 2). Like Seemann (2010), we experienced mapmaking as a process, rather than a product, a visualization of reality that is co-constructed, as in a conversation, rather than a fixed data point to be discovered or excavated. In other words, no map is the only possible creation, but each map is, instead, emergent.
Geographers Gould and White (1974) pointed out that hand-drawn maps are a way to make visible people's preferences, spatial desires, and biases. Jung (2014) reminds us that vernacular maps are not “pure.” When creating such a drawing, the map “not only reflects people's cognitive world but is also embedded in the power relations that affect such a world” (Jung 2014: 989). In our analysis, we keenly feel our own positionality in the process and the context of the creation. The maps were not spontaneously created, but rather are artifacts of our requests to draw a representation of the event at the event itself. We read them as discourse texts that have audience(s). We read them critically, contextually, and intertextually, looking for embedded social and power relationships.
Map Your Jazz Fest
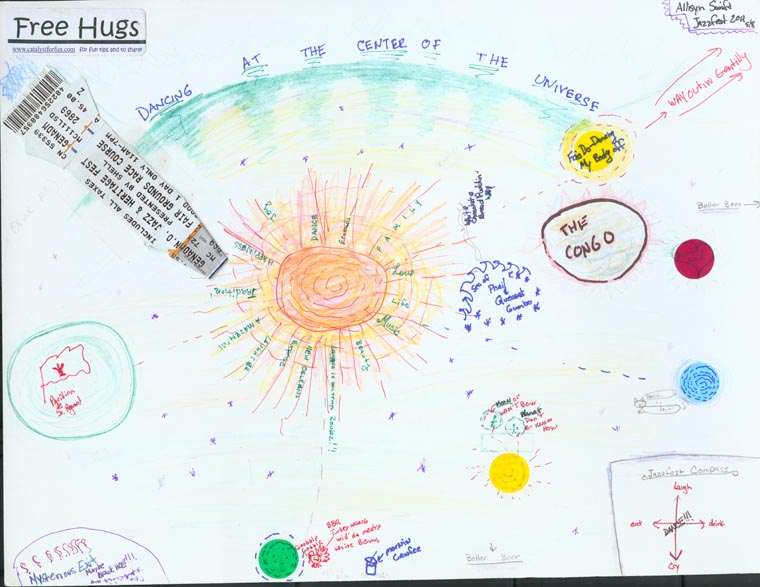
After researching the festival together since the early 2000s, we embarked on a collaboration with the Jazz & Heritage Foundation in 2010. We began documenting the festival folk, including the self-made crews/krewes who populate the festival, as well as documenting the activities outside the gates of the festival itself, the history and evolution of the festival craft areas, the folklife area, and Congo Square. In 2011, Shana was documenting some of the fan groups in the infield of the largest stage, now known as the Acura Stage. One group, the Magic Carpet Campground—a group of friends who have been sharing space at the largest stage for more than 25 years—produced four maps. One of thsee maps was the image in Figure 2.
The admission ticket is the spaceship providing entry to this universe, composed of planets and also radiating activities, emotions, and experiences of significance: “the Congo,“ “Sea of Phail and Queasant Gumbo,” and sun rays radiating dimensions of festival atmosphere: dance, friends, family, love, life, music, beauty, Laissez les bons temps roulez !!!, New Orleans, Surprise, laughter, amazement, irradiation, happiness, and love. Alyson's radiant drawing clearly illustrates her group's orientation to the festival as a whimsical event that connects to core values.
Among the cosmological features of Alyson's map are:
- White Chocolate Bread Pudding Way (riffing off of Milky Way galaxy)
- Fais Do-Dancing my body off
- Way out in Gentilly
- Moon of Won't Bow. Planet of Don't Know How
- Mornin' cawfee
- Better beer
- BBQ, Turkey Wang, Wid da meaty white beans
- Mysterious Exit
This festival cosmology explicitly references Black New Orleans through the Mardi Gras Indian chant (“Won't bow, don't know how”) and exagerrated and distorted Black English (“wang,” “wid da”). The last feature is a reference to the Mystery Street exit typically used by musicians, staff, and in-the-know festgoers as a way to avoid massive post-fest crowds.3 On the bottom right of the map is a Jazz Fest compass with the cardinal directions labeled as Laugh–Cry (the north-south axis), Drink—Eat (east-west axis) and at the center of the intersections—“Dance!!!” While Alyson's map is clearly a manifestation of a devout fandom and a commitment to positive energy (free hugs), other maps pointed to structural tensions or issues at the festival, as well as emotional connections to the landscape.
Tensions and Issues
One interesting thing about this seemingly silly method is that it quickly highlights some long-running strains and pressure points at the heart of the festival. In the remainder of the paper, we consider a series of maps that provide insights into issues of mobility, affect, and scale.
1. Mobility
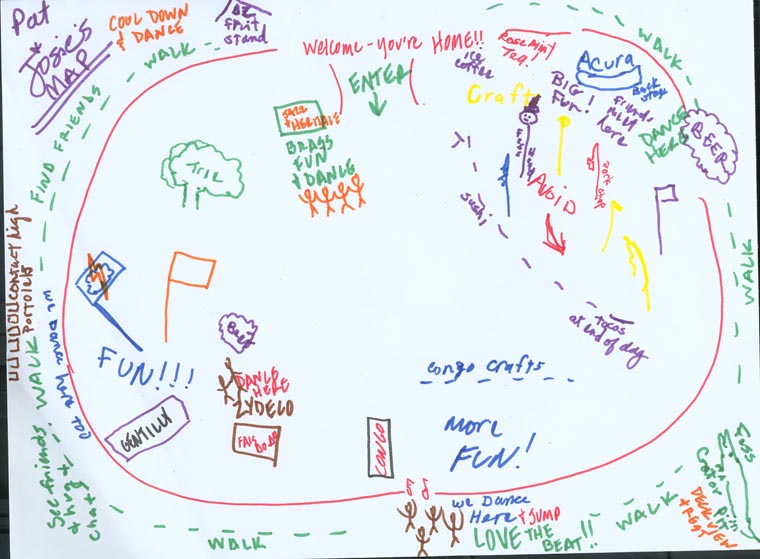
Avid festgoers pride themselves in knowing the shortcuts between stages and timing the food and drink runs to avoid long lines or saving a set at a smaller stage, often in the shade, to recover and prepare for a more taxing session at one of the larger stages, where it is inevitably more crowded and sweltering. Some even plan to attend an interview session in the air-conditioned grandstand in between other activities. At the same time, older festgoers and others who may have disabilities or injuries face the challenges of mobility—the physically arduous task of navigating a grassy infield, the heat, and long lines for the port-o-let. Three maps clearly illustrate these navigations and, sometimes, stresses. The map drawn by Pat and Josie [Figure 3] illustrates their shared love of festival and an orientation to the festival landscapes through movement.
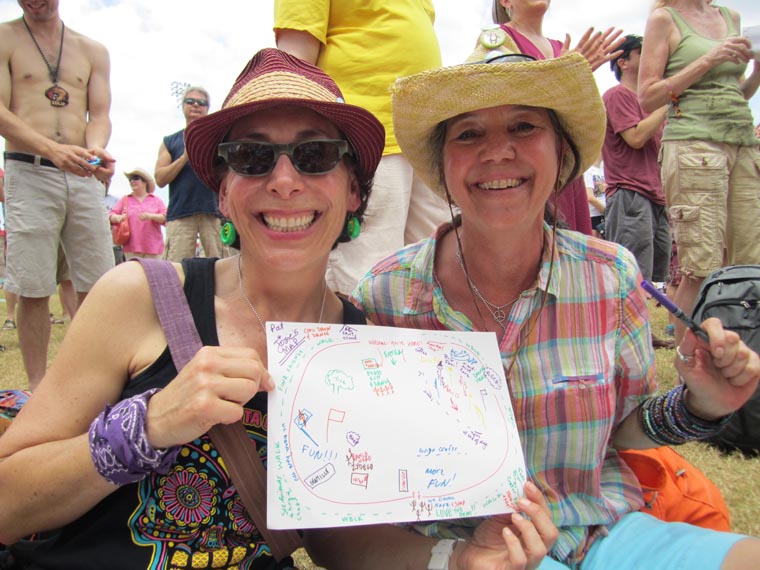
Beginning with “Welcome – you're home!” at the entrance, the map is full of verbs (dance, talk, walk) as well as nouns (rosemint tea, sushi, ice coffee, crafts) that imply eating, drinking, shopping. Motion is evoked through colored arrows, and action words, like “dance,” “see friends,” “we dance here” written on the track adjacent to Congo, and “tacos at the end of the day.” (So we don't have to worry about eating out in the evening, and battling with crowded restaurants, Josie explained, we can go home, shower, rest, change, and go hear more music). Pat and Josie's map clearly depicts the exuberant movement of festival devotees who roam the festival and whose day is filled with action (finding friends, chatting, dancing through the expanse of the festival grounds). In this vision of the festival, mobility is fluid. [Figure 4 shows Pat and Josie beaming with their map.]
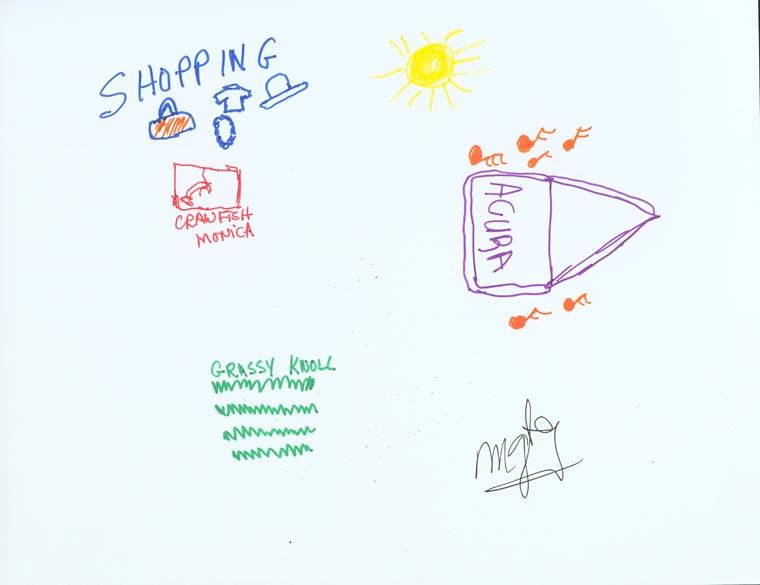
An alternate perspective is expressed by a festival veteran who is a member of the Grassy Knoll crew. When Helen Regis talked with her in 2013, she explained that joint issues made it increasingly difficult for her to navigate the vast and uneven terrain of the fairgrounds, but her membership in the Grassy Knoll crew, which sets up every year in the Acura infield, makes it possible for her to participate. Her map [Figure 5], one of the first we collected to feature a single stage, demonstrates that her festival experience is clearly grounded in one section of the Festival with limited forays for food, drinks, and bathrooms. Participating in a territorially based crew, for this older festgoer, is what makes her continued participation possible, providing her with safety, social support, and infrastructure (a cluster of chairs and someone to turn to should she need help).

The Grassy Knoll example suggests that groups formed by festgoers in their 20s and 30s to support an effervescent festival experience may become even more important as their core members age and come to rely on mutual aid to enable their continued participation. For someone recovering from a knee injury or a hip replacement, the walk from a parked car to the Acura infield could be a test of endurance. As soon as one has set up a circle of chairs, it is time to venture out for refreshments. Creating a campground ensures a place to rest—a welcome respite for many able-bodied fans—as well as conviviality and conversation. Of course, younger participants may face their own travails and one first-time festgoer (“Taz”) illustrated her experience of getting lost and requiring the medical tent, with a map {Figure 6] which included an arrow pointing off-map to “x1,000,000,000 miles from where I parked.” When Helen talked with her in 2012, she was laughing with a group of friends in the grassy expanse of the Gentilly infield, but her wry humor still betrayed that she had had a rough day. Her annotations on the Acura infield “Tundra? Siberia?” evoke her disorientation. Clearly, mobility issues also affect younger festgoers overwhelmed by the heat and crowds, unfamiliar with lay of the land, or experiencing crowd fatigue (“bathroom line abyss” ) sticker shock (“overpriced beer”) and possible heat exhaustion (“medical tent”). Several LSU students who were first time festgoers in 2015 expressed surprise at the scale of the festival and reported being exhausted by the walking, the heat, and crowds by 5pm, just as the headliners were setting up and a full two hours before the festival closing at 7pm.
2. Affect
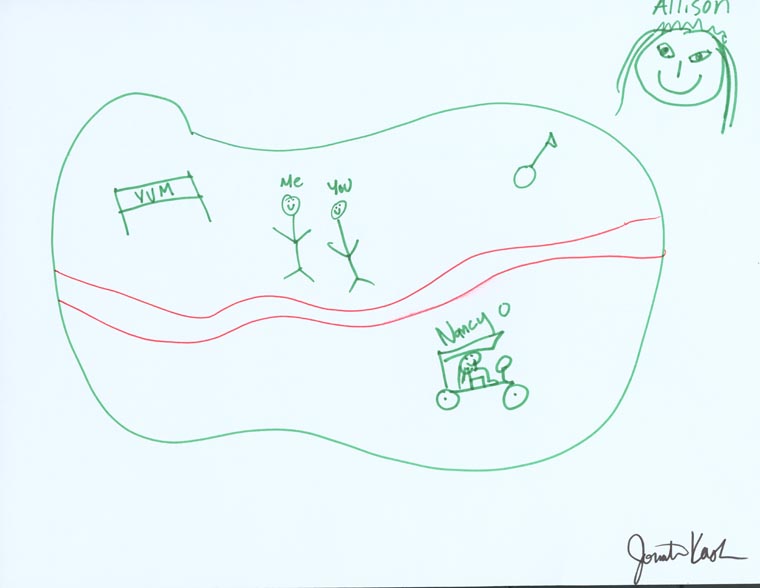
The drawings we collected often mapped out social worlds and expressed emotional connections (or averse reactions to) the festival landscape. Jonathan Kazlow, whose mother is Allison Miner, a co-founder of the Festival (Nesbitt 1998; Regis and Walton 2008), drew a map [Figure 7] that highlighted his friendship with festival producer Nancy Ochsenschlager and shows his mother's smiling spirit hovering over the festival. This map is a wonderful example of a sociometric map, presenting social relationships more than physical or musical landscapes. Our conversations with festgoers over the last decade of fieldwork makes it clear that, for many, the festival is as much about the people they meet as about the music they hear—though the two obviously go together.
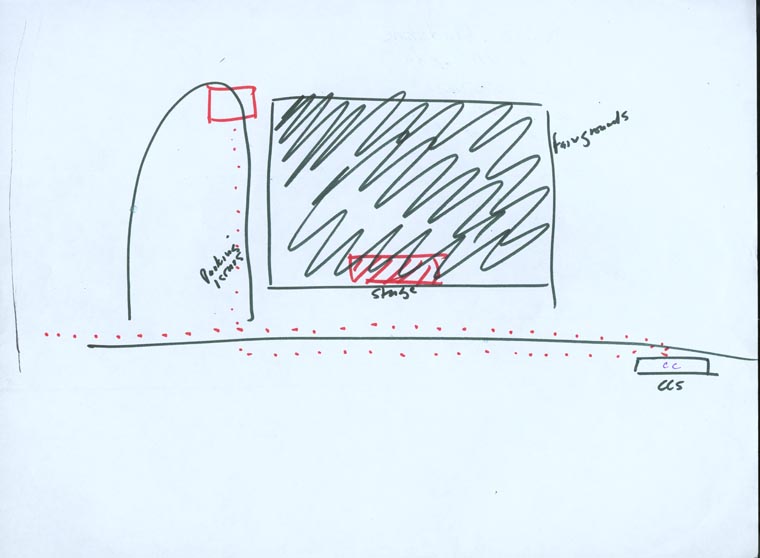
Another kind of affect and long-term festival tension tension is expressed by David, a resident of the Bayou St. John neighborhood near the fairgrounds in Mid-City [Figure 8].
His map provides an important counterpoint to the festival boosterism of many city residents and mainstream news outlets. For David, the festival occupies and disrupts his home space, preventing him from parking his car, walking his dog, or enjoying an otherwise tranquil, verdant area. In this map, we see Festival- as-nuisance. Large black/darkened areas show space that is inaccessible, blacked out. We note that the view expressed by this map is likely shared by some other neighborhood residents, who might be more reluctant to voice their views, for fear of being viewed as curmudgeons or worse.
The “dark cloud” map clearly illustrates some negative impacts of the Festival on the neighborhood (Hasselle 2015). The festival-as-nuisance is certainly a significant part of the festival experience of neighborhood residents—even if they love the fest and attend when they can. Others make it a point to never attend, and take pride in their personal boycott of the Festival. As longtime social activist M. Endesha Juakali told Helen in an interview: “It's a burden on the neighborhood and they never compensated the [neighbors of the festival].” By 1978, Juakali recalls, “the area adjacent to the festival was pretty much all black.” “Before the storm,” he recalls, “I lived on DeSaix Blvd.” During the festival, he and his neighbors had to endure “the music at all hours . . . people blocking your driveway—total disrespect for the neighborhood.” While many area residents clearly enjoy attending the festival and may well host annual pre- and post-fest parties and many others who cannot afford to buy tickets find other ways to participate by volunteering for the festival or either selling water or parking cars outside the gates, the nuisance map clearly illustrates the anger and resentment the festival causes for many others who find their neighborhood bears the brunt of hosting the event while they might not have a voice in public debates about the role of festivals and tourism in public life.
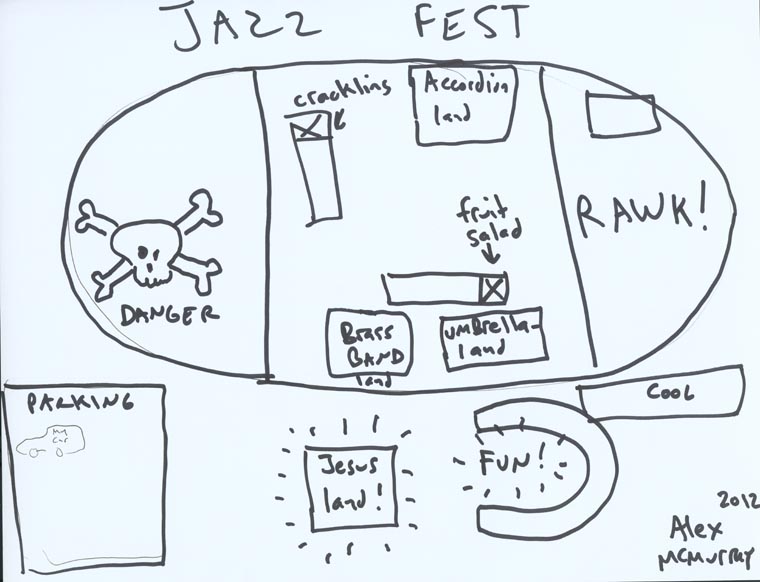
While David's map offers a critique in the form of a refusal to enter the fairgrounds, musician Alex created a map that combines a critical edge with exuberant engagement with festival landscape. [Figure 9] Alex's map, drawn in less than a minute with a black marker, stands out for its bold black lines and its playful renaming of music stages. Economy Hall becomes Umbrella- land; Gospel Tent becomes Jesus-land; Fais Do Do is Accordion- land, and so on. The festival's largest stage, sponsored by a car manufacturer and typically referred to by the brand, is here represented by the iconic skull and cross bones evoking piracy or poison and the legend “Danger.” This map is also a standout for the two foods mentioned in it—foods that might not often be eaten by the same person: fruit salad and cracklins.
While the “danger” map is like a cartoon that playfully highlights a love/hate relationship with the festival, the ambivalence it contains may well be shared by many professional musicians and other workers who love Jazz Fest but would like to be paid more for their work (see for example, Sakakeeny 2013: 95-103).
3. Growth: big vs. small
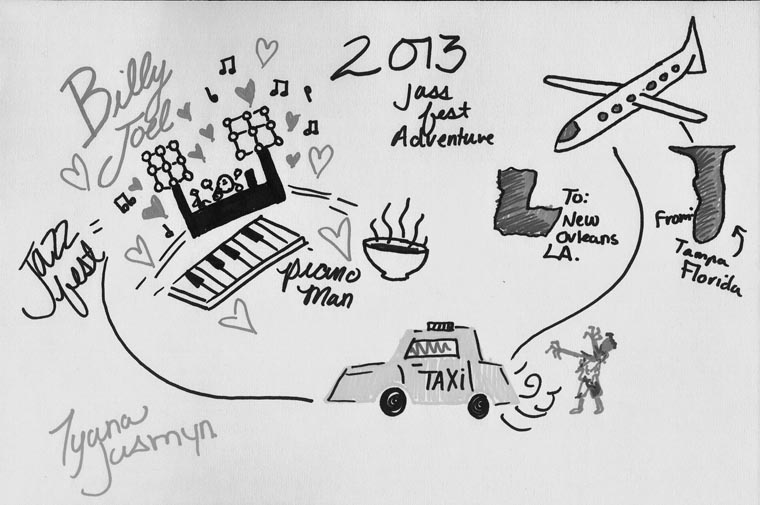
As long-time festgoers are aware, the massive crowds, growing presence of big-name musicians, and rapid increase in ticket prices are frequent topics of conversation among New Orleanians. Other controversial issues include the rise of corporate sponsorship (notably Acura and Shell), the tenuous, but still significant presence of local culture and heritage (Regis and Walton 2008), and the question of the socialization of the new festgoers to the multidimensionality of the festival. While many long-time festgoers value the rich diversity of festival music, crafts, and food and seek out collective experiences, many first-time festgoers we've encountered come to the festival as to a concert to see one specific band, be it Widespread Panic, The Who, Bon Jovi, Dave Matthews Band, or Pitbull. We collected a number of maps that featured a single musician or band, including the Foo Fighters, Billy Joel, and Bon Jovi, as well as Bruce Springsteen. This enthusiastic Billy Joel map [Figure 10] was drawn by a first time festgoer who flew from Florida to see the musician. She explained to the researcher that she had never before travelled in an airplane and referred to the entire trip as “My Jass Fest adventure.”
Other maps we collected highlight the influence a single pop artist can have on the festival atmosphere in a more critical vein, as in one sarcastic “Bruce Fest” map drawn by a long-time festival participant who resides in New Orleans. As he drew his rather severe map in black pencil, he laughed and said he was resigned about the massive crowds that occupied much of the festival real estate and joked that none of the other stages that day would be crowded during the final “headline” slot of the day. As the crowds would be huddled to see Mr. Springsteen, the rest of us would have free reign with other music stages.
Still other maps we collected either cross out the bigger stages (in some cases with an actual “X”) or omit them altogether or, like Alex's [Figure 9], rename them creatively. At the same time, other maps ignore the entire middle of the festival, implying the entire space is just a path from Acura to Gentilly with a soft shell crab po-boy in between. And beer. In fact, many festgoers we have met were unaware of the existence of the folk areas, the grandstands, or the international cultural pavilions—areas of central importance to these researchers and many of our friends and colleagues.
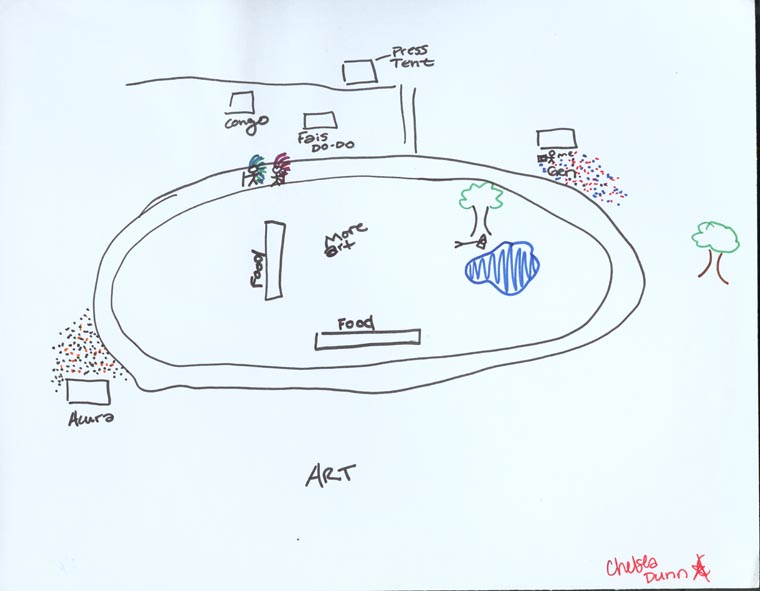
This map [Figure 11] drawn by volunteer photographer Chelsea features a minimalist representation of the festival. Beginning with the press tent, where photographers can download images, recharge batteries, rehydrate, and even upload news stories, her map features the volunteer/staff entrance and depicts the map-maker herself standing at the Gentilly stage and napping under the oak tree.
Significantly, in a map with only four music stages, two food areas, and two art areas (“art” and “more art”), she has drawn the figures of two Mardi Gras Indians—recognizable from their feathered headdress—walking around the infield, the most fully drawn of all the human representations (with two other stick figures, and Gentilly and Acura crowds evoked with an array of dots). The shift in scale and perspective from the Mardi Gras Indians (seen in profile view) walking around the racetrack to the dots representing the crowds at Gentilly and Acura (reminiscent of people seen from above) illustrates the tensions we are highlighting in this section. The massive crowds in the infield at the two biggest stages and the increasing large VIP areas situated between the stage and the “standing room only” public viewing areas represent an impediment to mobility and a no-go zone for the photographer who hopes to capture portraits of musicians and tradition-bearers.
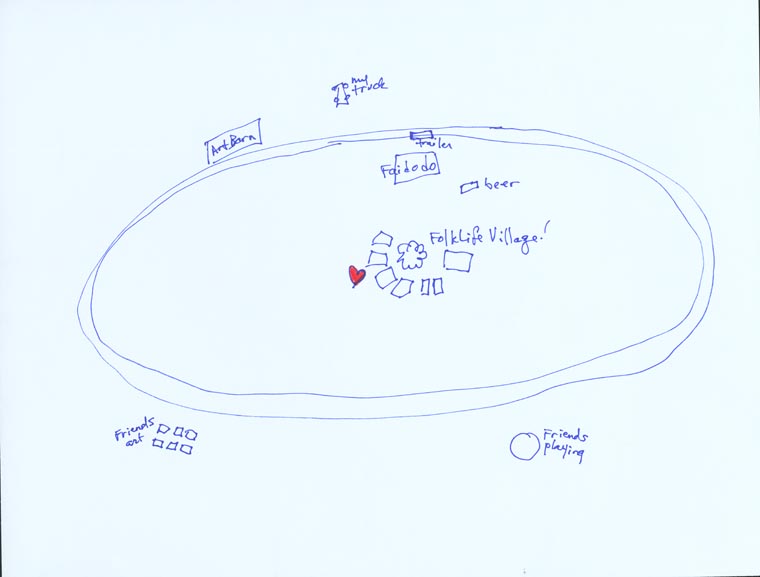
Kathleen's map [Figure 12] similarly highlights the folk area as the heart of the festival, which is also where she works. She told Helen that she ventures out to other zones only to see “friends playing” and “friends' art,” underlining her very personal engagement with festival landscapes as a place to reinforce friendship as well as working closely with colleagues, demonstrators, and visitors to the folklife area.
Discussion
This small collection of hand-drawn maps clearly illustrates the potential of this method to reflect on cultural heritage research in New Orleans. This paper represents preliminary analysis and a small sample of maps collected as part of a larger collaborative project. This larger project is intended to both assist the Jazz & Heritage Foundation in documenting the Festival and to contribute to critical conversations about issues of tourism and social justice, access, equity, and commodification of heritage. By way of conclusion, we offer preliminary reflections on map-making as a method in folklore research and as a form of community engagement.
We found that many festgoers who would not be willing to sit down (or stand) for an interview were willing to make a map. The paper, markers, and possibilities for playful interactions with family, friends, and others help to create an event, which is sociable. While some mapmakers talked while drawing, others listened to music and worked wordlessly. In some cases, we left mapmaking supplies (paper and a bag of markers) with the drawer and made a plan to come back later (perhaps at the end of a set) to pick up a map. In other instances we sat with the mapmaker and talked, taking notes on our conversation (with permission) as they drew. These included basic information about the mapmaker (years coming to Jazz Fest, residence, and perhaps age, gender, occupation, and orientation toward the festival). Sometimes, conversation specifically centered on the map itself. “You see, I'm drawing Sister Gertrude Morgan,”4 one map-maker explained, “because she is central to my experience of the festival, even though I haven't seen her here in years.” Geographers Downs and Stea (1977:27) have argued that “cognitive maps serve as coathangers for assorted memories.” In our experience, maps give us a path into festgoer visions of the past as well as the present festival landscape. One veteran festgoer narrated as she drew, explaining, and deciding on a coding system with black or gray pencil indicating people who are no longer at the fest (clearly highlighting the memory map dimension) and using other colors to mark contemporary performers or features of the festival.
We found that the narratives are often key to understanding the maps. They aren't necessarily transparent. Gentry Hanks (2011) made a similar observation in her analysis of garage sale maps. Hanks notes that the inclusion of specific details on hand-drawn maps invites reflection and prompts the reader to ask questions and imagine their own narratives: “Not only do mental maps tell stories, they provide the opportunity for readers of the maps to imagine and to create stories” (Hanks 2011: 87). While these visual stories are inherently interesting, Hanks suggests, the inclusion of interviews with map-makers can clearly make them more useful.
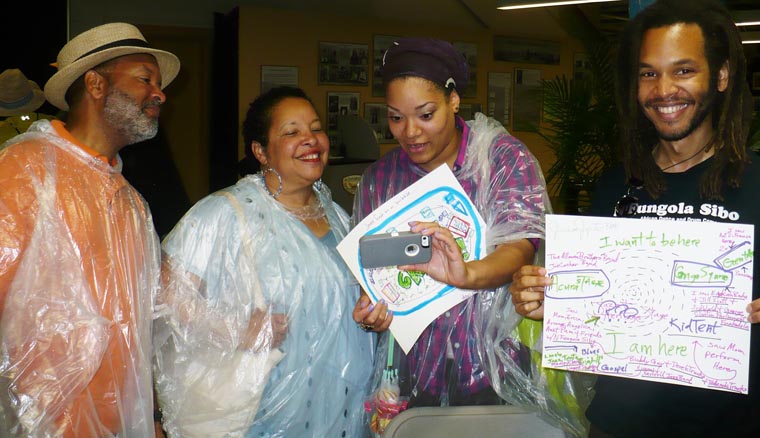
We became especially aware of this when reviewing maps collected by students. For instance, one map collected in 2014 has a focal image of a guy and a truck, which on the surface makes no sense for the festival. But then you see the field notes and you realize that it's a narrative—his map depicts him riding around the festival on the forklift because he is a staff member and a member of the construction crew. The forklift is a central vehicle for understanding his experience of the festival landscape. Without the narrative, the map is completely opaque. In other maps, people wrote lots of words, but in many cases, they did not. Because we kept the maps for deposit in the Jazz & Heritage Archive, people often wanted to take pictures of themselves with their maps. They saw themselves as creating a keepsake or souvenir of their visit [Figure 13].
In conclusion, we suggest that mapmaking as a research method has allowed us to learn much about the diversity of landscapes experienced (and created) by festgoers. The 2013 exhibit featured a digital slide show of maps organized by a series of questions that served as prompts for festgoers starting the mapdrawing task. We end by offering you, the reader, these same questions as possible considerations for starting your own festival map journey.
- What are your Jazz Fest traditions?
- Do you start your day with beignets, cochon de lait or rosemint tea?
- Do you tour the crafts and then, clutching your cubes, dash from stage to stage?
- Do you get here early, set up some chairs, and then beat a path between the stage and the nearest beer tent? Or do you wander the grounds, pulled in only by the music that calls to you?
- What are your favorite foods and crafts?
- What paths do you take?
- What part of the festival is most important to you?
- Where do you spend most of your time?
- Where do you find your Jazz Fest community?
Notes
1. The authors would like to thank all the mapmakers who contributed to our documentation of the festival and the many who participated in map collection, including students at Louisiana State University. We are grateful to the support of the New Orleans Jazz & Heritage Foundation, especially Executive Director Don Marshall, Archivist Rachel Lyons, and Dolores Hooper, Associate Archivist. Participants in the project include photographers: Xiomara Castro, Chelsea Dunn, Morgan Sasser, Gary Lafleur, Owen Murphy, and Jeffrey David Ehrenreich. Their photographic vision has informed our writing and analysis. Three LSU students participated in the project over several years: Tajji Abney, Jamie DiGilormo, and Erin Jordan. This work was supported in part by Jazz & Heritage Foundation Community partnership grants for Documentation and Preservation in 2011, 2012, and 2013.
2. We are indebted to Jorn Seemann for this historical genealogy of maps in field research (Seemann 2010:119) and to Gentry Hanks for her enthusiasm for collecting hand-drawn maps in another project.
3. Musician Paul Sanchez and Coleman DeCay have written a song about this called “Exit to Mystery Street.”
4. Sister Gertrude: See Elaine Yau's forthcoming PhD Dissertation on Sister Gertrude Morgan entitled “Acts of Conversion: Sister Gertrude Morgan and the Sensation of Black Folk Art, 1960-1983.”
Sources
Brand Polanco, Mieka. 2014. Historically Black: Imagining Community in a Black History District. New York: NYU Press.
Briggs, Charles. 1986. Learning How to Ask: A Sociolinguistic Appraisal of the Roel of the Interview in Social Science Research. Cambridge: Cambridge University Press.
Downs, R. and D. Stea. 1977. Maps in minds: reflections on cognitive mapping. New York: Harper & Row.
Hanks, Gentry. 2011. “We Live in a Used World:” Cultural Geographies of American Garage Sales. MA thesis, Department of Geography & Anthropology, Louisiana State University.
Harmon, K. 2003. You Are Here: Personal Geographies and Other Maps of the Imagination (1st ed.). City: Princeton Architectural Press.
Hasselle, Della. 2015. Jazz Fest Crowds Worry Patrons, Burden Mid-City and Neighboring Residents. Mid-City Messenger, posted May 4. http://midcitymessenger.com/2015/05/04/jazz-fest-crowds-worry-patrons-burden-mid-city-and-neighboring-residents/
Jung, H. 2014. Let Their Voices Be Seen: Exploring Mental Mapping as a Feminist Visual Methodology for the Study of Migrant Women. International Journal Of Urban & Regional Research 38(3): 985-1002.
Nesbitt, Amy. 1998. Reverence. VHS videocassette. New Orleans: Video Veracity.
Lees, L. 2004 The emancipatory city?: paradoxes and possibilities. London; Thousand Oaks, CA: Sage Publications.
Maloney, Stephen. 2014. Creating Culture: The Rituals, Customs, and Traditions of Jazz Fest. Offbeat (Jazz Fest Issue), May 1, 2014. (digital resource: www.jazzfest.com)
Monmonier, Mark. 1993. Mapping it Out: Expository Cartography for the Humanities and Social Sciences. University of Chicago Press.
Orlove, Benjamin. 2002. Lines in the water. Nature and culture at Lake Titicaca. Berkeley: University of California Press.
Pandolfo, Stefania. 1989. Detours of life: Space and Bodies in a Morrocan village. American Ethnologist 16(1): 3-23.
Pandya, V. 1990. Movement and Space: Andamanese Cartography. American Ethnologist 17: 775-797.
Preston, Dennis. 1985. Mental Maps of Language Distribution in Rio Grande do Sul Brazil, Geographical Bulletin 27:46-64.
______. 1982. Perceptual Dialectology: Mental Maps of United States Dialects from Hawaiiian Perspective. Working Papers in Linguistics 14 (2): 5-49.
Regis, Helen A. and Shana Walton. 2008. Producing the Folk at the New Orleans Jazz and Heritage Festival. Journal of American Folklore 121 (482): 400-440.
Sakakeeny, Matt. 2013. Roll With It: Brass Bands in the Streets of New Orleans. Durham: Duke University Press.
Seemann, Jorn. 2010. Regional Narratives, Stories Maps and Storied Places: Cultural Cartographies of the Cariri Region, Northeastern Brazil. PhD Dissertation, Department of Geography & Anthropology, Louisiana State University.
Wilburn, Kelcy. 2014. Loud and Proud: the Flag Bearers of Jazz Fest. Offbeat (Jazz Fest issue), May 1, 2014.
